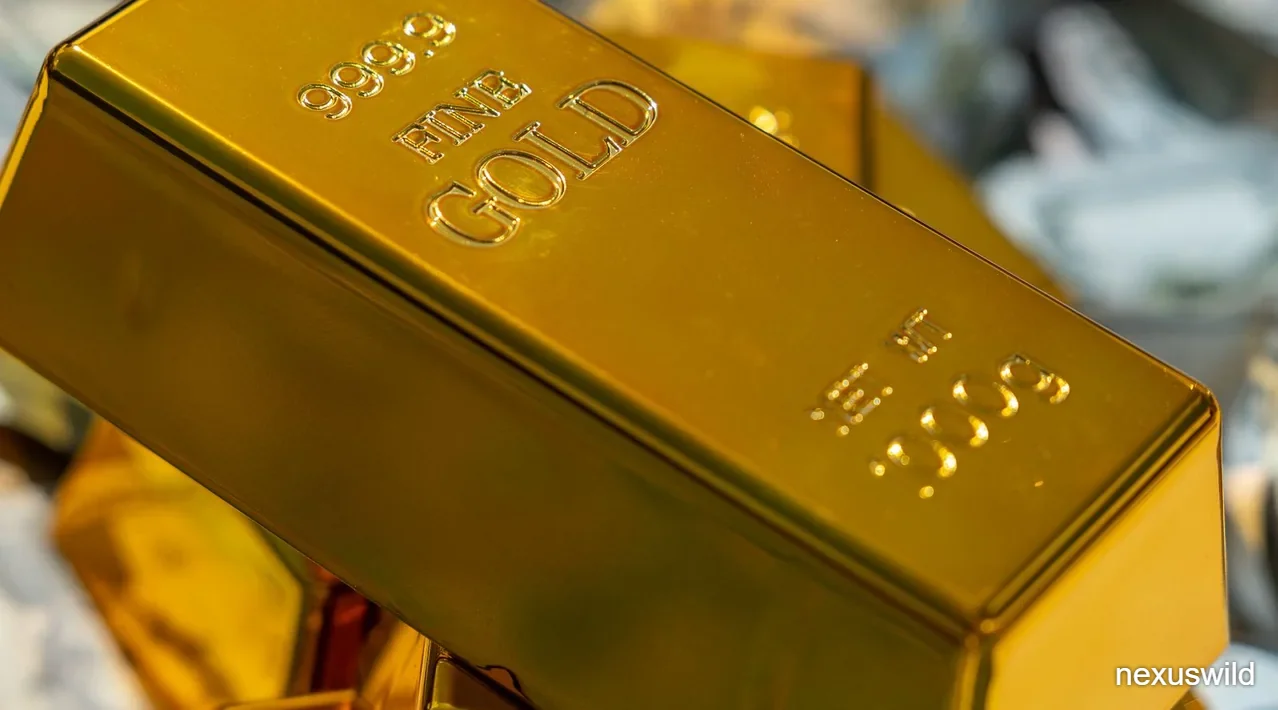

Gold reached its lowest price in more than a year on Friday, 20 November 2026, and closed the week with its steepest decline in eight months as traders repriced the likelihood of another Federal Reserve interest-rate increase. The move was not a quiet drift. Spot bullion touched $3,513.54 an ounce, its lowest level since early September 2025, and was quoted down 2.8% at $3,518.50 late in the New York session. December US futures fell 4.5% to $3,519.10 in the same snapshot. A week earlier, the market had been trading above $3,891 an ounce.
The selloff crossed asset classes. Silver fell more than 3% on the day and was trading roughly two-thirds below its January record, while platinum and palladium also declined. Equities were sliding worldwide after a technology listing failed to restore faith in the AI trade, and analysts said some gold positions were being liquidated to cover losses elsewhere. The dollar extended its rally, raising the cost of holding a metal that pays no interest.
This article explains what happened in gold, why the rate outlook mattered so much, how forced selling and currency moves interacted, and what longer-term demand data says about the market's underlying structure. The numbers come from Reuters reporting carried by several outlets, commodity specialist coverage and the World Gold Council's published research. Where quotes differ by time of day, the timestamps are given.
Bullion's worst week in eight months
The weekly scale of the decline was as significant as the single-day fall. Reuters, quoted by CNBC, reported that bullion had shed about 9.5% during the week to 20 November. Kitco's earlier version of the same Reuters story, filed around 1113 GMT, put the weekly loss at about 8% and described it as the most since the week ended 20 March. The difference reflects the time of the two snapshots: prices kept falling through the European and US sessions.
Either figure represents a sharp reversal. The World Gold Council's Weekly Markets Monitor dated 16 November had recorded the LBMA Gold Price PM closing the previous Friday at $3,891 an ounce, down 3.9% week on week and at its second-lowest level of the year. That report said the year-to-date loss stood at 10.9% at that point. The following week extended the decline substantially.
Reuters described gold as floundering to a 14-month low and heading for its worst week in eight months. The phrase captures the mood: this was not a normal pullback within an established trend but a break to a new low in the current cycle. Traders who had bought the earlier dip were now facing losses, and the market's short-term positioning had turned decisively bearish.
The intraday low and the scale of the drop
The price path on 20 November shows how quickly sentiment changed. Kitco's Reuters story reported spot gold down 1% at $3,585.92 by 1113 GMT, after touching $3,513.54 earlier in the session. By 2:36 p.m. ET, CNBC quoted spot gold down 2.8% at $3,518.50. Reuters later reported a 3% decline to $3,514.08 in a separate update.
US gold futures for December delivery followed a similar trajectory. Kitco quoted them down 2.7% at $3,587.90 in the morning, while CNBC reported a 4.5% fall to $3,519.10 later in the day. Futures tend to amplify moves in a fast market because of leverage and margin requirements.
MarketScreener's Euronext feed provided cross-asset confirmation: spot gold fell 2.02% to $3,548.53 an ounce and spot silver 2.54% to $41.66, both trading at their lowest since September 2025. Copper declined 2.71% to $12,186.00 a tonne. Yahoo Finance reported LME copper down 2.4% to $12,190.68 per tonne and US copper futures 1.3% lower at $5.52 per pound. The similarities in the numbers reflect different timestamps rather than conflicting data.
The safest reconstruction is that gold traded between roughly $3,513 and $3,589 during the day, the lower end marking the 14-month trough. By any measure, it was a severe one-day loss.
Why a rate-hike bet hurts gold
Gold pays no coupon or dividend. Its appeal therefore depends partly on what investors can earn elsewhere. When policy rates rise or are expected to rise, Treasury yields tend to increase and the opportunity cost of holding bullion grows. That relationship was central to the November selloff.
Reuters reported that the selloff gathered pace after Philadelphia Fed President Anna Paulson joined other policymakers in flagging inflation risks that could warrant another interest-rate increase. Kitco's version of the story said markets saw a 99% chance of a 25-basis-point hike in December according to CME's FedWatch tool. CNBC's later update put the probability at 96%. The small difference reflects changing odds during the session; both figures indicate near-certainty in the market's pricing.
David Meger, director of metals trading at High Ridge Futures, spelled out the logic in comments carried by CNBC. Higher interest rates, a stronger dollar and the prospect of persistent inflation that prompts the Fed to keep raising rates all negatively affect gold, he said. Those were precisely the conditions traders were pricing on 20 November.
It is worth noting that the 10-year Treasury yield actually fell on the day. MarketScreener reported a 10.43-basis-point decline to 4.948%, the biggest daily drop since 22 October, while the 30-year yield fell 6.81 basis points to 5.3329%. But a one-day safe-haven rally in bonds does not reverse the policy outlook. gold was responding to the expected path of short-term rates, not only to the day's move in long yields.
The dollar and real yields tighten the screw
A firm dollar was the second pillar of the bear case. Reuters said the dollar extended its rally on safe-haven demand as Asian shares tumbled. Because gold is priced in dollars, a stronger currency makes bullion more expensive for buyers using other currencies and can suppress demand. It also tends to accompany tighter global financial conditions.
The combination of a stronger dollar and elevated yields is a difficult environment for any non-yielding asset. Kitco quoted Critical Metals CEO Tony Sage saying that hawkish Fed expectations were lifting real yields and the dollar, raising the opportunity cost of holding gold. Real yields — nominal yields adjusted for inflation — are particularly relevant because they measure what investors give up in genuine terms.
The World Gold Council's 3 November outlook had noted that higher policy rates, bond yields and a stronger dollar could weigh on fourth-quarter demand, even while fiscal concerns and financial-market stress offered support. That anticipated the competing forces visible on 20 November.
The dollar move did not occur in isolation. It was part of the same global deleveraging that hit technology shares and crypto. Gold fell despite its haven status because in a cash-raising episode liquidity needs can outweigh diversification motives.
Forced selling links gold to the AI rout
Commodity analysts repeatedly cited forced liquidation as an amplifier. Meger told Reuters that the ongoing AI-related equity selloff was prompting some liquidation of gold positions to cover losses. Sage made the same point in Kitco's report, describing gold as under renewed pressure from hawkish expectations while the equity selloff prompted forced sales elsewhere.
This mechanism explains why gold fell at the same time as Treasury yields declined. In a normal risk-off session, investors buy both government bonds and gold. When investors need cash to meet margin calls or rebalance portfolios, they may sell whatever is liquid, including gold. The result can look like a breakdown in gold's safe-haven status, when in fact it reflects the mechanics of leverage.
The equity backdrop was extraordinary. Reuters reported that Asian shares tumbled and were headed for their worst week since 2020 after Anthropic's market debut failed to restore confidence in the AI sector. CNBC reported US futures dropping. Reuters' global markets coverage described a rout driven by worries about valuations, borrowing costs and corporate profitability.
Gold's link to that story was indirect but real. Large multi-asset funds often run exposures across equities, bonds and commodities. When one part of the book loses value, risk limits can force reductions elsewhere. Analysts quoted in the reporting were careful to describe forced selling as a contributing factor, not the sole cause. The underlying cause remained the hawkish rate repricing.
Silver, platinum and palladium slide too
Gold was not alone in the precious-metals complex. CNBC reported spot silver down 3.8% at $41.12 an ounce, around 66% below its record high of $121.64 hit in January. Platinum dropped 3% to $1,303.05 and palladium slid 1.9% to $892.20. All precious metals were poised for a second straight weekly decline.
Earlier in the session, Kitco had quoted silver down 0.4% at $42.58, platinum down 2.6% at $1,309.36 and palladium down 0.3% at $906.67. Again, the differences reflect timing. The direction was uniform: all four major precious metals were lower.
Sage explained the common drivers in comments to Reuters. Silver, platinum and palladium were declining in tandem with gold primarily because of the same macro factors, he said. Silver is typically more volatile and amplifies the move, while platinum and palladium are also sensitive to growth concerns that accompany tighter monetary policy.
Silver's position deserves particular attention. A drop of roughly two-thirds from a record high is not a routine correction. It suggests that the January peak was driven by a combination of scarcity, speculation and momentum that has since unwound. Industrial demand for silver also ties it more closely than gold to the global growth outlook, which was deteriorating as the AI trade soured.
Physical buyers step in as paper prices fall
Not all demand weakened. Kitco's Reuters story reported that physical gold demand in India and China strengthened during the week as the price slump attracted bargain hunters, with investors in China viewing the correction as a buying opportunity. This is a familiar pattern in gold markets: lower prices can bring out buyers who had been waiting on the sidelines.
The World Gold Council's Q3 2026 demand data showed the tension between these groups. Investment demand excluding over-the-counter activity reached 479 tonnes in the third quarter, 14% below the exceptionally strong third quarter of 2025. Bar and coin demand fell to 268 tonnes, a four-year low, as retail investors awaited a clear price trend. Physically backed ETFs, by contrast, added 211 tonnes during the quarter.
Jim Wyckoff, a market analyst at American Gold Exchange, offered a short-term view quoted by CNBC. Prices in the next few sessions could still drop a lot more, he said, but from a timing perspective a bottom in gold and silver was likely sooner rather than later. That is a judgement, not a fact, but it reflects the view that the selloff was becoming stretched.
What the ETF data says about investor behaviour
Exchange-traded fund flows provide a window into how professional investors have been positioned. The World Gold Council reported that global physically backed gold ETFs added $2.7 billion in October 2026, their fourth consecutive monthly expansion, lifting holdings by 19 tonnes to 4,275 tonnes. Assets under management fell 6% to $542 billion because of the lower gold price.
Regional patterns were revealing. European funds added $1.8 billion, their fourth straight month of inflows, while Asian investors bought $1.3 billion. North American funds saw $512 million of outflows, the only negative region. The Council noted that US technology equities came under selling pressure in October amid concerns about AI-related capital spending, and that the resulting stress may have contributed to gold ETF outflows as investors used their gold holdings as a source of liquidity.
That insight is directly relevant to November. If equity market stress was already prompting gold ETF redemptions in October, the sharper AI selloff of 20 November would be expected to intensify the pattern. The mechanism is the same one described by commodity analysts: gold is liquid, so it gets sold when cash is needed elsewhere.
The longer-term picture is more supportive. For the first ten months of 2026, global gold ETFs added $41 billion, the third strongest period on record, and holdings rose by 246 tonnes. European and Asian investors accounted for 44% and 45% of net inflows respectively. That suggests the November price fall occurred against a backdrop of substantial strategic accumulation, not a wholesale abandonment of the asset class.
Central banks remain a structural buyer
Official-sector buying is another pillar of demand. Kitco commentary published on 9 November, citing World Gold Council figures, reported central banks purchased a net 321 tonnes of gold in the third quarter of 2026, a 42% increase year on year and the highest quarterly total since late 2024. Year-to-date purchases reached 675 tonnes, up 6% from the same period in 2025. China and Poland led reported purchases with 63 and 40 tonnes respectively.
The World Gold Council's own Q3 outlook said central bank demand had exceeded expectations and that full-year purchases were expected to at least match 2025. It also cautioned that purchases appear sensitive to price. That pattern could provide some support during a decline, but the Council noted the relationship is not stable enough to imply a firm floor.
The Council's Q3 data showed total gold demand of 1,369 tonnes, down 1% year on year, while demand value rose 22% to $188 billion at an average price of $4,262 an ounce. The gap between volume and value illustrates how much the price had risen before the correction. It also explains why the current fall, severe as it is, leaves gold well above historical norms.
How this fits the wider 2026 correction
The November leg lower belongs to a longer story. Gold had reached a record high in January, and Kitco reported that silver's January record of $121.64 remained far above its November level. The World Gold Council's 16 November monitor said gold was down 10.9% year to date at that point. The following week pushed the decline deeper.
Several forces drove the correction. Expectations of US rate cuts gave way to a hawkish repricing after hotter inflation data. October meeting minutes and subsequent Fed commentary reinforced the shift, while scrutiny of AI equity valuations created both a source of stress and a reason to raise cash. Energy pressures complicated the inflation picture.
Through it all, ETF holdings remained near record levels and central banks kept buying. That divergence — strong strategic demand alongside weak price performance — is a defining feature of the 2026 gold market and why analyst commentary was mixed.
The World Gold Council's outlook captured the balance. It pared its average full-year investment demand forecast from plus 400 tonnes to plus 200 tonnes year on year, citing slower bar and coin demand, while maintaining that investment would remain the main driver of total demand growth. In other words, the structural story survived even as the near-term trade deteriorated.
What could stabilise the market
Three questions now dominate. The first is whether the Fed's December meeting confirms the rate-hike expectations priced into the market. With FedWatch odds near 96% to 99% on 20 November, much of the move is already in the price. A surprise in either direction would be consequential.
The second is whether the AI-driven equity selloff continues. Forced liquidation of gold positions depends on losses elsewhere. If equities stabilise, the cash-raising pressure should ease. If they keep falling, gold could remain exposed even if its own fundamentals are intact. Reuters reported that the global rout had been building for days, and there was no evidence on 20 November that it had ended.
The third is whether physical demand at lower prices is sufficient to absorb paper selling. Reports from India and China were encouraging, and central bank buying remained substantial. But the World Gold Council has warned that official purchases are price-sensitive, which means a falling price can attract buyers without necessarily creating a durable floor.
For now, the factual record is clear. Gold fell to a 14-month low on 20 November 2026, lost about 8% to 9.5% over the week depending on the snapshot, and dragged silver, platinum, palladium and copper lower with it. The proximate causes were a hawkish Fed repricing, a stronger dollar and forced selling linked to the AI equity rout. The longer-term demand picture was considerably more resilient. Whether those two realities converge in December will depend on the central bank and on how long the equity selloff lasts.
Nexuswild welcomes factual corrections. Email contact@nexuswild.com with evidence and the article URL.