
LONDON, Sept. 17, 2026 - The world’s two great polar ice sheets have lost more than 11 trillion tonnes of ice since the late 1970s, according to the longest reconciled satellite record yet assembled.
The new assessment combines 42 independent surveys from 27 satellite missions and tracks Greenland back to 1972 and Antarctica back to 1979.
Between 1979 and 2023, Greenland and Antarctica together lost 11,309 billion tonnes of ice.
That loss raised global mean sea level by 31.4 millimetres, or just over three centimetres.
The headline number is enormous.
But the most important finding is not simply that ice is disappearing.
It is how the ice is being lost.
The study finds that 84% of the combined loss came from glacier dynamical imbalance: ice flowing out of the interior and being discharged into the ocean faster than snowfall could replace it.
Only 16% of the combined loss was attributed to reduced surface mass balance.
That means the long-term story of polar ice loss cannot be explained by surface melting alone.
The glaciers draining the Greenland and Antarctic ice sheets are themselves moving and discharging ice into the ocean at an accelerating rate.
The longest combined record yet
The work comes from the Ice Sheet Mass Balance Inter-comparison Exercise, or IMBIE, an international collaboration supported by major space agencies and polar research institutions.
The project exists because no single satellite technique provides a perfect measurement of ice-sheet mass.
Scientists instead combine several approaches.
Satellite altimetry measures changes in ice-sheet height.
Gravimetry measures changes in Earth’s gravity field caused by changes in ice mass.
The input-output method compares snowfall accumulation with the amount of solid ice flowing across the grounding line and into the ocean.
The 2026 assessment reconciles those different measurements into one record.
For Greenland, the researchers combined 23 estimates.
For Antarctica, they combined 19.
Together, those 42 surveys draw on observations from 27 satellite missions.
The result is a record long enough to show not only that the ice sheets are losing mass, but how the rate and mechanism of that loss changed over multiple decades.
Greenland lost more than six trillion tonnes
Greenland lost 6,215 ± 467 billion tonnes of ice between 1972 and 2023.
Across that period, its average loss was about 119 billion tonnes per year.
But that average hides the acceleration.
Greenland was close to balance during the 1970s.
In the 1980s, its rate of loss was about 60 billion tonnes per year.
In the 1990s, it was about 57 billion tonnes per year.
By the 2000s, the rate had more than tripled to about 192 billion tonnes per year.
In the 2010s, Greenland was losing around 264 billion tonnes every year.
That decade included several extreme summer melt events and marked the point at which surface-driven loss became more important than glacier dynamics within Greenland itself.
Even so, the long-term Greenland total remains dominated by ice discharge.
The new assessment attributes about 67% of Greenland’s cumulative loss to increased glacier discharge and about 33% to reduced surface mass balance.
Antarctica lost nearly 4.8 trillion tonnes
Antarctica lost 4,780 ± 513 billion tonnes between 1979 and 2023.
That added about 13.3 millimetres to global mean sea level.
The mechanism differs from Greenland.
The assessment attributes essentially all of Antarctica’s net ice-sheet loss to ice dynamics.
In other words, Antarctica’s long-term mass decline was driven by the movement of ice from the grounded ice sheet toward and into the ocean.
That process is especially important in West Antarctica.
Warm ocean water can reach the underside of floating ice shelves.
As those shelves thin or retreat, the resistance they provide to inland glaciers can weaken.
The grounded glaciers behind them can then accelerate.
The effect is similar to removing part of a brake.
The ice that was previously held back can flow faster toward the sea.
West Antarctica is the critical region
The strongest Antarctic loss signal is in West Antarctica.
According to the new record, ice-discharge losses from West Antarctica increased in every decade studied.
The rate rose from about 29 ± 7 billion tonnes per year in the 1980s to about 163 ± 12 billion tonnes per year in the 2010s.
Two glaciers are central to the concern: Pine Island and Thwaites.
Both drain large areas of the West Antarctic Ice Sheet into the Amundsen Sea.
Satellite observations have shown major changes in this region, including grounding-line retreat and faster glacier flow.
The grounding line is where ice resting on bedrock begins to float.
If that line retreats inland into deeper terrain, more of the glacier can become vulnerable to ocean-driven melting and dynamic acceleration.
This is why scientists pay such close attention to West Antarctica even during years when snowfall elsewhere temporarily improves the continent-wide mass balance.
Thwaites is not losing ice in isolation
Thwaites Glacier often receives attention because of its potential implications for future sea level.
But it is part of a larger system.
The new long-term record shows that the key issue is not a single glacier breaking apart in one dramatic event.
It is a persistent imbalance across major drainage basins.
Ice discharge can continue for decades as ocean conditions, ice-shelf thinning, bed geometry and glacier dynamics interact.
That makes satellite monitoring essential.
A short period of stability does not necessarily mean the system has returned to balance.
East Antarctica recently gained mass
One of the most important cautions in the new dataset is that the recent period does not look exactly like the 2010s.
Between 2020 and 2023, Antarctica’s overall rate of ice loss slowed substantially.
The main reason was unusually high snowfall over East Antarctica.
The study estimates a positive East Antarctic mass gain of about 92 ± 63 billion tonnes per year during those four years.
That extra snow was large enough to offset part of the continuing losses elsewhere.
As a result, the rate of total Antarctic mass loss during 2020 to 2023 was more than three times smaller than during the 2010s.
This does not mean Antarctica has stopped losing ice.
It means snowfall temporarily changed the continent-wide balance.
The underlying dynamic losses in West Antarctica did not disappear.
Greenland also slowed after 2020
Greenland showed a similar short-term moderation, but for a different reason.
Between 2020 and 2023, Greenland lost ice at about 199 ± 29 billion tonnes per year.
That remained a major loss.
But it was lower than the 264 billion tonnes per year recorded during the 2010s.
The study attributes the change mainly to surface conditions.
The early 2020s did not include the same sequence of extreme summer melt events that characterized parts of the previous decade.
Surface-mass-balance-driven loss was roughly half the level seen in the 2010s.
Dynamic glacier loss, however, continued at a similar pace.
That distinction is critical.
A few relatively mild summers can reduce meltwater runoff without reversing decades of glacier acceleration.
What surface mass balance means
An ice sheet gains mass mainly through snowfall.
It loses surface mass through melting, runoff, sublimation and other processes.
The difference is called surface mass balance.
If snowfall exceeds surface losses, surface mass balance is positive.
If melting and runoff exceed accumulation, it becomes negative.
But surface mass balance is only one part of an ice sheet’s total budget.
Ice can also be lost dynamically when glaciers transport solid ice into the ocean.
The new IMBIE dataset separates these mechanisms.
That is how researchers concluded that 84% of the combined Greenland-Antarctica loss between 1979 and 2023 came from glacier dynamics.
Why 11.3 trillion tonnes matters
A trillion tonnes is difficult to visualize.
The most useful conversion is the one that directly affects people: sea level.
The combined loss contributed 31.4 ± 1.6 millimetres to global mean sea-level rise between 1979 and 2023.
About 360 billion tonnes of land ice corresponds to roughly one millimetre of global mean sea-level rise.
Three centimetres does not sound dramatic when imagined against a seawall.
But sea-level rise is cumulative.
It raises the baseline from which high tides, storm surges and coastal flooding operate.
A storm that produces the same surge as it did decades earlier can now begin from a higher ocean level.
That makes extreme water levels easier to reach.
The ice sheets now drive a large share of sea-level rise
The new analysis says Greenland and Antarctica together are now responsible for roughly one quarter of global sea-level rise.
Other contributors include mountain glaciers and thermal expansion, the physical expansion of seawater as it warms.
The balance between these sources changes over time.
What is important is that polar ice-sheet loss has become a central component rather than a distant future risk.
It is already measurable in the global ocean.
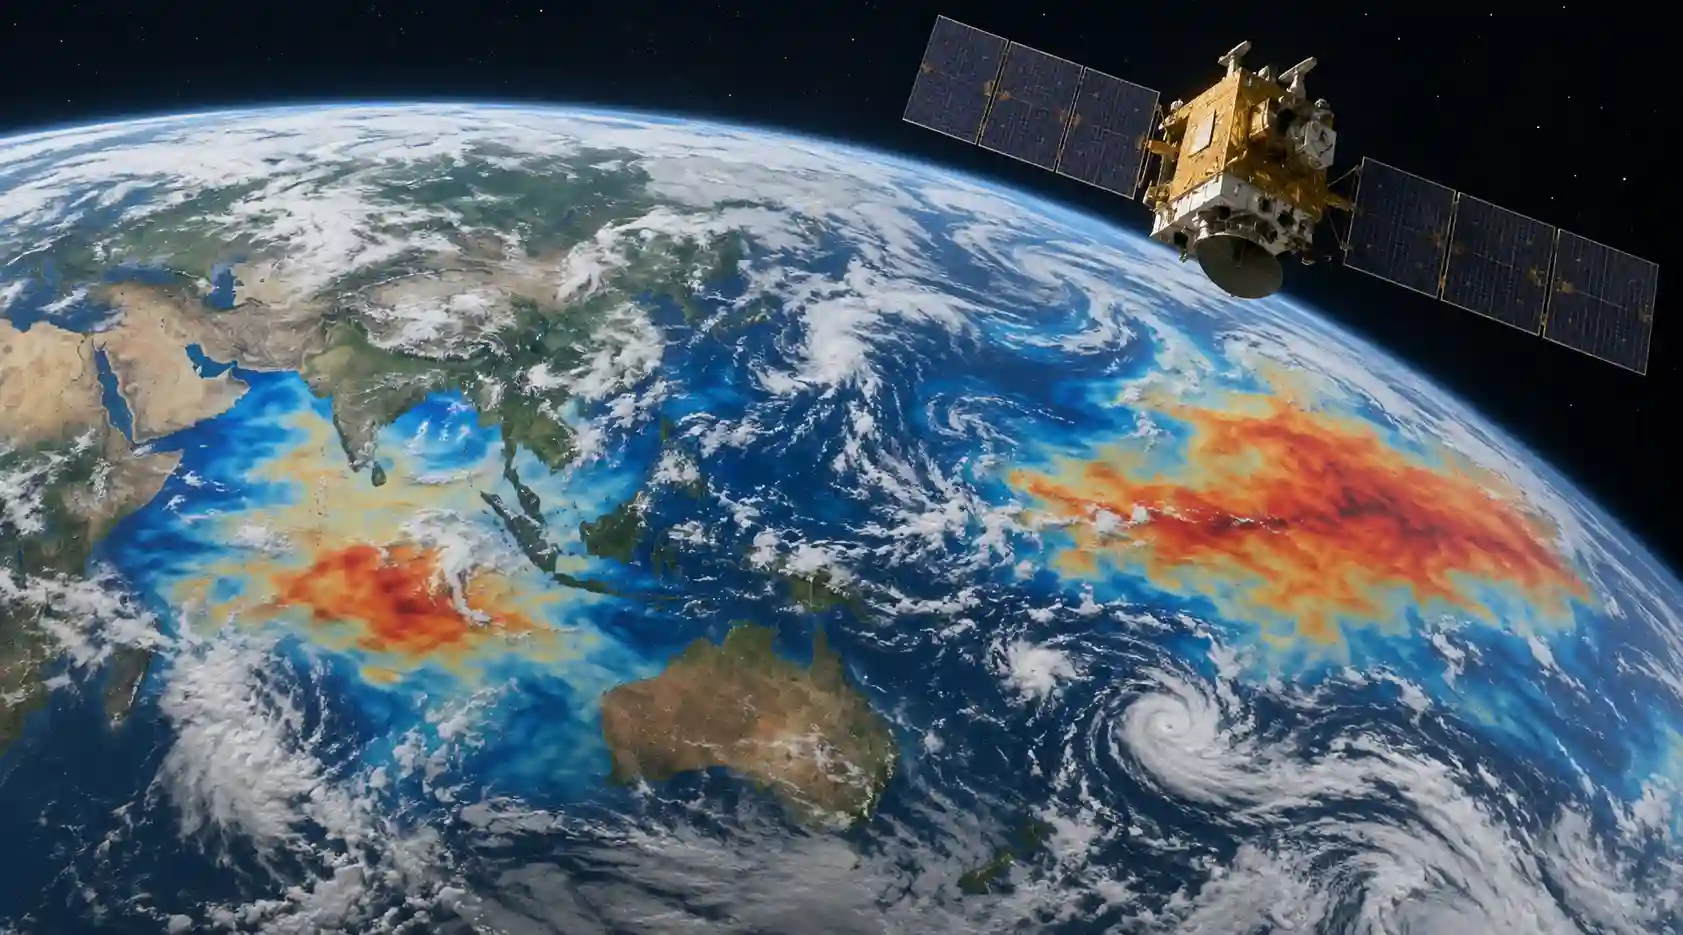
Satellite observations are what make this visible
The new record would not be possible from field stations alone.
Greenland and Antarctica are too large.
The study uses observations from missions that measure ice elevation, gravity, velocity and surface change.
Early Landsat imagery allowed scientists to reconstruct glacier flow back into the 1970s.
More recent radar missions can observe ice movement through clouds and polar darkness.
Gravimetry missions detect changes in mass through tiny variations in Earth’s gravity field.
Altimeters measure changes in the height of the ice surface.
No single method is sufficient everywhere.
Combining them reduces uncertainty.
That reconciliation is one of IMBIE’s main scientific contributions.
A dramatic 2026 Greenland calving event shows the system is still active
Recent observations continue to show rapid physical change.
In August 2026, a 76-square-kilometre section of the floating tongue of Petermann Glacier in northwest Greenland broke away.
The event was the glacier’s largest loss of floating ice since 2012.
The new iceberg was estimated to be up to 150 metres thick.
That event occurred after the 2023 endpoint of the new IMBIE mass-balance record, so it is not part of the 11.3-trillion-tonne calculation.
It is nevertheless an example of the continuing dynamism of Greenland’s outlet glaciers.
Calving from floating ice does not directly raise sea level in the same way that loss of grounded ice does.
The concern is what floating ice shelves and tongues do for the grounded ice behind them.
If their restraining effect weakens, inland ice can accelerate toward the sea.
Floating ice and grounded ice are not the same
This distinction is often lost in discussions of polar melting.
Floating ice is already displacing ocean water.
When a floating iceberg melts, its direct contribution to sea level is relatively small.
Grounded ice is different.
It sits on land or bedrock.
When that ice enters the ocean, it adds new water mass to the sea.
The IMBIE assessment focuses on ice-sheet mass changes that contribute to sea-level rise.
It does not simply add every observed loss of floating ice shelves.
That is one reason its sea-level calculation is scientifically meaningful.
The 2020-2023 slowdown is not a reversal
A reader could look at the recent snowfall gains in East Antarctica or the milder Greenland summers and conclude that the problem is easing.
The researchers explicitly caution against that interpretation.
Short-term climate variability can temporarily increase snowfall or reduce melting.
The long-term trend is still one of net mass loss.
Greenland moved from approximate balance in the 1970s to losses above 200 billion tonnes per year in recent decades.
West Antarctic ice discharge increased in every decade of the record.
A four-year slowdown does not erase that trajectory.
Why future sea level remains uncertain
Ice sheets are one of the largest sources of uncertainty in long-term sea-level projections.
The difficulty is not only predicting future air temperature.
Scientists also have to understand how warming oceans interact with ice shelves, how grounding lines migrate, how glacier speed changes, and whether large sectors of grounded ice can become dynamically unstable.
The new dataset improves that work because models can be tested against a half-century of observations.
A model that cannot reproduce the historical record is less credible when projecting the future.
Longer records therefore reduce uncertainty even when they do not eliminate it.
What the new study does not say
The study does not say that all polar ice will disappear soon.
It does not claim that the 11.3 trillion tonnes vanished in a single melt event.
It does not show a uniform loss across every part of Antarctica.
And it does not mean surface melting is unimportant.
Greenland’s surface melt was especially significant during the 2010s.
The central conclusion is more specific.
Across the combined ice sheets, long-term mass loss has been dominated by the dynamic acceleration and discharge of glaciers into the ocean.
That is a different process from simply watching ice melt under warm air.
The strict conclusion
The most important number from the new polar record is 11,309 billion tonnes.
That is how much ice Greenland and Antarctica together lost between 1979 and 2023.
The loss raised global mean sea level by 31.4 millimetres.
Greenland alone lost more than 6.2 trillion tonnes.
Antarctica lost nearly 4.8 trillion tonnes.
And 84% of the combined loss came from glacier dynamics rather than reduced surface mass balance.
Those numbers change how the story should be understood.
Polar ice loss is not only a surface-melting problem.
It is a flow problem.
Glaciers are transporting ice from the interiors of the great ice sheets into the ocean faster than the system can replace it.
Snowfall can temporarily slow the net loss.
Milder summers can temporarily reduce surface melt.
But the satellite record now reaches far enough back to show the underlying trajectory clearly.
The polar ice sheets are lighter than they were half a century ago.
The missing mass is already part of the ocean.
Reader questions
Frequently asked questions
How much ice have Greenland and Antarctica lost?
The new IMBIE assessment finds the two ice sheets together lost 11,309 ± 565 billion tonnes of ice between 1979 and 2023.
How much sea-level rise did that ice loss cause?
The combined ice loss raised global mean sea level by 31.4 ± 1.6 millimetres, or just over three centimetres.
Was most of the ice lost by surface melting?
No. The study attributes about 84% of the combined loss to glacier dynamical imbalance, meaning faster glacier flow and discharge into the ocean. Reduced surface mass balance accounted for about 16%.
How much ice has Greenland lost?
Greenland lost 6,215 ± 467 billion tonnes between 1972 and 2023, with about 67% of the cumulative loss linked to increased ice discharge and 33% to reduced surface mass balance.
How much ice has Antarctica lost?
Antarctica lost 4,780 ± 513 billion tonnes between 1979 and 2023, adding about 13.3 millimetres to global mean sea level.
Why did polar ice loss slow between 2020 and 2023?
East Antarctica received unusually high snowfall, while Greenland experienced relatively mild summers that reduced surface melt. These changes slowed net losses temporarily but did not reverse the long-term decline.
Why are Thwaites and Pine Island glaciers important?
They drain major parts of West Antarctica and have experienced strong dynamic changes. Faster ice discharge from this region is a major contributor to Antarctica's long-term mass loss.
Does melting floating ice directly raise sea level?
Floating ice already displaces seawater, so its direct effect is small. The larger concern is that loss of floating ice shelves or tongues can reduce resistance on grounded glaciers behind them, allowing grounded ice to flow faster into the ocean.
Nexuswild welcomes factual corrections. Email [email protected] with evidence and the article URL.